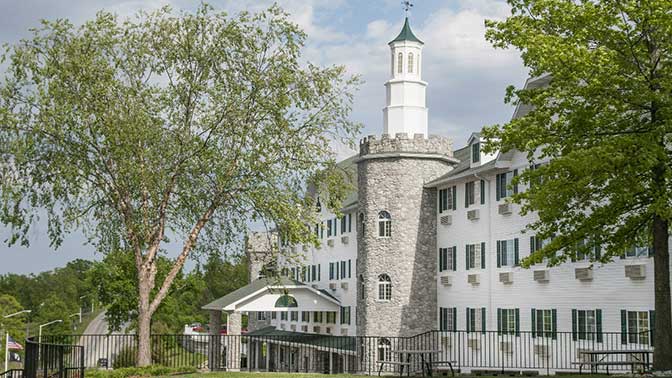
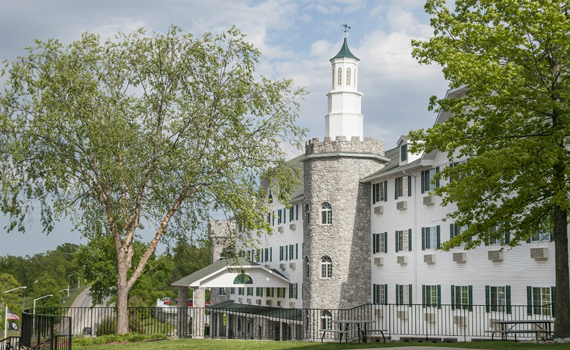
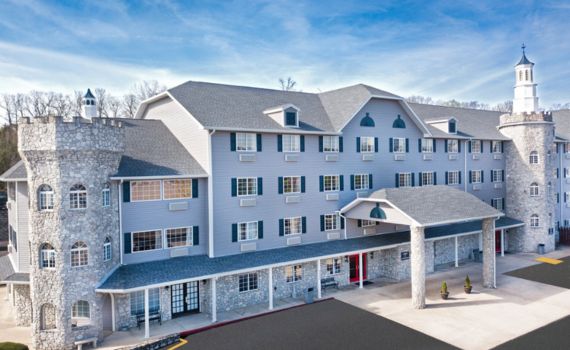
Page 1
Table DP-1. Profile of General Demographic Characteristics: 2000
Geographic area: Stone County, Missouri
[For information on confidentiality protection, nonsampling error, and definitions, see text]
Subject
Number Percent
Total population. . . . . . . . . . . . . . . . . . . . . . . . . .
28,658
100.0
SEX AND AGE
Male . . . . . . . . . . . . . . . . . . . . . . . . . . . . . . . . . . . . . . . .
14,052
49.0
Female. . . . . . . . . . . . . . . . . . . . . . . . . . . . . . . . . . . . . .
14,606
51.0
Under 5 years . . . . . . . . . . . . . . . . . . . . . . . . . . . . . . .
1,565
5.5
5 to 9 years . . . . . . . . . . . . . . . . . . . . . . . . . . . . . . . . .
1,727
6.0
10 to 14 years . . . . . . . . . . . . . . . . . . . . . . . . . . . . . . .
1,749
6.1
15 to 19 years . . . . . . . . . . . . . . . . . . . . . . . . . . . . . . .
1,704
5.9
20 to 24 years . . . . . . . . . . . . . . . . . . . . . . . . . . . . . . .
1,162
4.1
25 to 34 years . . . . . . . . . . . . . . . . . . . . . . . . . . . . . . .
2,881
10.1
35 to 44 years . . . . . . . . . . . . . . . . . . . . . . . . . . . . . . .
3,940
13.7
45 to 54 years . . . . . . . . . . . . . . . . . . . . . . . . . . . . . . .
4,099
14.3
55 to 59 years . . . . . . . . . . . . . . . . . . . . . . . . . . . . . . .
2,184
7.6
60 to 64 years . . . . . . . . . . . . . . . . . . . . . . . . . . . . . . .
2,218
7.7
65 to 74 years . . . . . . . . . . . . . . . . . . . . . . . . . . . . . . .
3,474
12.1
75 to 84 years . . . . . . . . . . . . . . . . . . . . . . . . . . . . . . .
1,487
5.2
85 years and over . . . . . . . . . . . . . . . . . . . . . . . . . . . .
468
1.6
Median age (years). . . . . . . . . . . . . . . . . . . . . . . . . . .
44.1
(X)
18 years and over . . . . . . . . . . . . . . . . . . . . . . . . . . . .
22,520
78.6
Male . . . . . . . . . . . . . . . . . . . . . . . . . . . . . . . . . . . . . .
10,859
37.9
Female. . . . . . . . . . . . . . . . . . . . . . . . . . . . . . . . . . . .
11,661
40.7
21 years and over . . . . . . . . . . . . . . . . . . . . . . . . . . . .
21,635
75.5
62 years and over . . . . . . . . . . . . . . . . . . . . . . . . . . . .
6,752
23.6
65 years and over . . . . . . . . . . . . . . . . . . . . . . . . . . . .
5,429
18.9
Male . . . . . . . . . . . . . . . . . . . . . . . . . . . . . . . . . . . . . .
2,550
8.9
Female. . . . . . . . . . . . . . . . . . . . . . . . . . . . . . . . . . . .
2,879
10.0
RACE
One race . . . . . . . . . . . . . . . . . . . . . . . . . . . . . . . . . . . .
28,314
98.8
White . . . . . . . . . . . . . . . . . . . . . . . . . . . . . . . . . . . . .
27,983
97.6
Black or African American . . . . . . . . . . . . . . . . . . .
21
0.1
American Indian and Alaska Native. . . . . . . . . . .
175
0.6
Asian . . . . . . . . . . . . . . . . . . . . . . . . . . . . . . . . . . . . .
52
0.2
Asian Indian . . . . . . . . . . . . . . . . . . . . . . . . . . . . .
6
-
Chinese . . . . . . . . . . . . . . . . . . . . . . . . . . . . . . . . .
7
-
Filipino . . . . . . . . . . . . . . . . . . . . . . . . . . . . . . . . . .
10
-
Japanese. . . . . . . . . . . . . . . . . . . . . . . . . . . . . . . .
8
-
Korean. . . . . . . . . . . . . . . . . . . . . . . . . . . . . . . . . .
11
-
Vietnamese. . . . . . . . . . . . . . . . . . . . . . . . . . . . . .
-
-
Other Asian
1
. . . . . . . . . . . . . . . . . . . . . . . . . . . .
10
-
Native Hawaiian and Other Pacific Islander. . . .
10
-
Native Hawaiian. . . . . . . . . . . . . . . . . . . . . . . . . .
3
-
Guamanian or Chamorro . . . . . . . . . . . . . . . . . .
4
-
Samoan. . . . . . . . . . . . . . . . . . . . . . . . . . . . . . . . .
2
-
Other Pacific Islander
2
. . . . . . . . . . . . . . . . . . .
1
-
Some other race . . . . . . . . . . . . . . . . . . . . . . . . . . .
73
0.3
Two or more races . . . . . . . . . . . . . . . . . . . . . . . . . . .
344
1.2
Race alone or in combination with one
or more other races:
3
White . . . . . . . . . . . . . . . . . . . . . . . . . . . . . . . . . . . . . . .
28,315
98.8
Black or African American . . . . . . . . . . . . . . . . . . . . .
36
0.1
American Indian and Alaska Native. . . . . . . . . . . . .
440
1.5
Asian . . . . . . . . . . . . . . . . . . . . . . . . . . . . . . . . . . . . . . .
90
0.3
Native Hawaiian and Other Pacific Islander. . . . . .
25
0.1
Some other race . . . . . . . . . . . . . . . . . . . . . . . . . . . . .
107
0.4
Subject
Number Percent
HISPANIC OR LATINO AND RACE
Total population. . . . . . . . . . . . . . . . . . . . . . . . . .
28,658
100.0
Hispanic or Latino (of any race) . . . . . . . . . . . . . . . .
298
1.0
Mexican. . . . . . . . . . . . . . . . . . . . . . . . . . . . . . . . . . .
144
0.5
Puerto Rican. . . . . . . . . . . . . . . . . . . . . . . . . . . . . . .
31
0.1
Cuban . . . . . . . . . . . . . . . . . . . . . . . . . . . . . . . . . . . .
3
-
Other Hispanic or Latino . . . . . . . . . . . . . . . . . . . .
120
0.4
Not Hispanic or Latino . . . . . . . . . . . . . . . . . . . . . . . .
28,360
99.0
White alone. . . . . . . . . . . . . . . . . . . . . . . . . . . . . . . .
27,797
97.0
RELATIONSHIP
Total population. . . . . . . . . . . . . . . . . . . . . . . . . .
28,658
100.0
In households. . . . . . . . . . . . . . . . . . . . . . . . . . . . . . . .
28,397
99.1
Householder . . . . . . . . . . . . . . . . . . . . . . . . . . . . . . .
11,822
41.3
Spouse . . . . . . . . . . . . . . . . . . . . . . . . . . . . . . . . . . .
7,647
26.7
Child. . . . . . . . . . . . . . . . . . . . . . . . . . . . . . . . . . . . . .
6,925
24.2
Own child under 18 years . . . . . . . . . . . . . . . .
5,503
19.2
Other relatives . . . . . . . . . . . . . . . . . . . . . . . . . . . . .
981
3.4
Under 18 years . . . . . . . . . . . . . . . . . . . . . . . . .
440
1.5
Nonrelatives . . . . . . . . . . . . . . . . . . . . . . . . . . . . . . .
1,022
3.6
Unmarried partner. . . . . . . . . . . . . . . . . . . . . . .
525
1.8
In group quarters. . . . . . . . . . . . . . . . . . . . . . . . . . . . .
261
0.9
Institutionalized population. . . . . . . . . . . . . . . . . . .
190
0.7
Noninstitutionalized population . . . . . . . . . . . . . . .
71
0.2
HOUSEHOLD BY TYPE
Total households. . . . . . . . . . . . . . . . . . . . . . . . .
11,822
100.0
Family households (families). . . . . . . . . . . . . . . . . . .
8,843
74.8
With own children under 18 years . . . . . . . . . .
3,022
25.6
Married-couple family . . . . . . . . . . . . . . . . . . . . . . .
7,647
64.7
With own children under 18 years . . . . . . . . . .
2,308
19.5
Female householder, no husband present . . . . .
847
7.2
With own children under 18 years . . . . . . . . . .
504
4.3
Nonfamily households . . . . . . . . . . . . . . . . . . . . . . . .
2,979
25.2
Householder living alone . . . . . . . . . . . . . . . . . . . .
2,524
21.4
Householder 65 years and over . . . . . . . . . . . .
1,212
10.3
Households with individuals under 18 years . . . . .
3,364
28.5
Households with individuals 65 years and over . .
3,721
31.5
Average household size. . . . . . . . . . . . . . . . . . . . . . .
2.40
(X)
Average family size. . . . . . . . . . . . . . . . . . . . . . . . . . .
2.76
(X)
HOUSING OCCUPANCY
Total housing units. . . . . . . . . . . . . . . . . . . . . . .
16,241
100.0
Occupied housing units . . . . . . . . . . . . . . . . . . . . . . .
11,822
72.8
Vacant housing units. . . . . . . . . . . . . . . . . . . . . . . . . .
4,419
27.2
For seasonal, recreational, or
occasional use. . . . . . . . . . . . . . . . . . . . . . . . . . . .
2,874
17.7
Homeowner vacancy rate (percent). . . . . . . . . . . . .
3.5
(X)
Rental vacancy rate (percent). . . . . . . . . . . . . . . . . .
18.3
(X)
HOUSING TENURE
Occupied housing units . . . . . . . . . . . . . . . . . .
11,822
100.0
Owner-occupied housing units . . . . . . . . . . . . . . . . .
9,595
81.2
Renter-occupied housing units . . . . . . . . . . . . . . . . .
2,227
18.8
Average household size of owner-occupied units.
2.38
(X)
Average household size of renter-occupied units .
2.49
(X)
- Represents zero or rounds to zero.
(X) Not applicable.
1
Other Asian alone, or two or more Asian categories.
2
Other Pacific Islander alone, or two or more Native Hawaiian and Other Pacific Islander categories.
3
In combination with one or more of the other races listed. The six numbers may add to more than the total population and the six percentages
may add to more than 100 percent because individuals may report more than one race.
Source: U.S. Census Bureau, Census 2000.
U.S. Census Bureau
1

Page 2
Table DP-2. Profile of Selected Social Characteristics: 2000
Geographic area: Stone County, Missouri
[Data based on a sample. For information on confidentiality protection, sampling error, nonsampling error, and definitions, see text]
Subject
Number Percent
SCHOOL ENROLLMENT
Population 3 years and over
enrolled in school. . . . . . . . . . . . . . . . . . . .
5,502
100.0
Nursery school, preschool . . . . . . . . . . . . . . . . . . . . .
425
7.7
Kindergarten. . . . . . . . . . . . . . . . . . . . . . . . . . . . . . . . .
339
6.2
Elementary school (grades 1-8) . . . . . . . . . . . . . . . .
2,761
50.2
High school (grades 9-12) . . . . . . . . . . . . . . . . . . . . .
1,460
26.5
College or graduate school . . . . . . . . . . . . . . . . . . . .
517
9.4
EDUCATIONAL ATTAINMENT
Population 25 years and over . . . . . . . . . .
20,799
100.0
Less than 9th grade . . . . . . . . . . . . . . . . . . . . . . . . . .
1,186
5.7
9th to 12th grade, no diploma. . . . . . . . . . . . . . . . . .
2,900
13.9
High school graduate (includes equivalency). . . . .
8,076
38.8
Some college, no degree. . . . . . . . . . . . . . . . . . . . . .
5,002
24.0
Associate degree. . . . . . . . . . . . . . . . . . . . . . . . . . . . .
673
3.2
Bachelor’s degree . . . . . . . . . . . . . . . . . . . . . . . . . . . .
2,011
9.7
Graduate or professional degree . . . . . . . . . . . . . . .
951
4.6
Percent high school graduate or higher . . . . . . . . .
80.4
(X)
Percent bachelor’s degree or higher . . . . . . . . . . . .
14.2
(X)
MARITAL STATUS
Population 15 years and over . . . . . . . . . .
23,605
100.0
Never married . . . . . . . . . . . . . . . . . . . . . . . . . . . . . . .
3,523
14.9
Now married, except separated . . . . . . . . . . . . . . . .
15,683
66.4
Separated . . . . . . . . . . . . . . . . . . . . . . . . . . . . . . . . . . .
294
1.2
Widowed . . . . . . . . . . . . . . . . . . . . . . . . . . . . . . . . . . . .
1,713
7.3
Female. . . . . . . . . . . . . . . . . . . . . . . . . . . . . . . . . . . .
1,391
5.9
Divorced . . . . . . . . . . . . . . . . . . . . . . . . . . . . . . . . . . . .
2,392
10.1
Female. . . . . . . . . . . . . . . . . . . . . . . . . . . . . . . . . . . .
1,310
5.5
GRANDPARENTS AS CAREGIVERS
Grandparent living in household with
one or more own grandchildren under
18 years . . . . . . . . . . . . . . . . . . . . . . . . . . . . .
445
100.0
Grandparent responsible for grandchildren . . . . . .
218
49.0
VETERAN STATUS
Civilian population 18 years and over . .
22,509
100.0
Civilian veterans . . . . . . . . . . . . . . . . . . . . . . . . . . . . .
4,171
18.5
DISABILITY STATUS OF THE CIVILIAN
NONINSTITUTIONALIZED POPULATION
Population 5 to 20 years. . . . . . . . . . . . . . .
5,535
100.0
With a disability . . . . . . . . . . . . . . . . . . . . . . . . . . . . . .
463
8.4
Population 21 to 64 years. . . . . . . . . . . . . .
16,047
100.0
With a disability . . . . . . . . . . . . . . . . . . . . . . . . . . . . . .
3,288
20.5
Percent employed . . . . . . . . . . . . . . . . . . . . . . . . . .
45.0
(X)
No disability . . . . . . . . . . . . . . . . . . . . . . . . . . . . . . . . .
12,759
79.5
Percent employed . . . . . . . . . . . . . . . . . . . . . . . . . .
70.0
(X)
Population 65 years and over . . . . . . . . . .
5,278
100.0
With a disability . . . . . . . . . . . . . . . . . . . . . . . . . . . . . .
1,907
36.1
RESIDENCE IN 1995
Population 5 years and over . . . . . . . . . . .
27,076
100.0
Same house in 1995. . . . . . . . . . . . . . . . . . . . . . . . . .
14,389
53.1
Different house in the U.S. in 1995 . . . . . . . . . . . . .
12,555
46.4
Same county . . . . . . . . . . . . . . . . . . . . . . . . . . . . . .
4,048
15.0
Different county . . . . . . . . . . . . . . . . . . . . . . . . . . . .
8,507
31.4
Same state . . . . . . . . . . . . . . . . . . . . . . . . . . . . . .
3,903
14.4
Different state. . . . . . . . . . . . . . . . . . . . . . . . . . . .
4,604
17.0
Elsewhere in 1995. . . . . . . . . . . . . . . . . . . . . . . . . . . .
132
0.5
Subject
Number Percent
NATIVITY AND PLACE OF BIRTH
Total population. . . . . . . . . . . . . . . . . . . . . . . . . .
28,658
100.0
Native. . . . . . . . . . . . . . . . . . . . . . . . . . . . . . . . . . . . . . .
28,329
98.9
Born in United States . . . . . . . . . . . . . . . . . . . . . . .
28,200
98.4
State of residence . . . . . . . . . . . . . . . . . . . . . . . .
13,541
47.3
Different state. . . . . . . . . . . . . . . . . . . . . . . . . . . .
14,659
51.2
Born outside United States . . . . . . . . . . . . . . . . . .
129
0.5
Foreign born. . . . . . . . . . . . . . . . . . . . . . . . . . . . . . . . .
329
1.1
Entered 1990 to March 2000 . . . . . . . . . . . . . .
86
0.3
Naturalized citizen. . . . . . . . . . . . . . . . . . . . . . . . . .
215
0.8
Not a citizen . . . . . . . . . . . . . . . . . . . . . . . . . . . . . . .
114
0.4
REGION OF BIRTH OF FOREIGN BORN
Total (excluding born at sea). . . . . . . . . . . . . .
329
100.0
Europe. . . . . . . . . . . . . . . . . . . . . . . . . . . . . . . . . . . . . .
140
42.6
Asia . . . . . . . . . . . . . . . . . . . . . . . . . . . . . . . . . . . . . . . .
73
22.2
Africa . . . . . . . . . . . . . . . . . . . . . . . . . . . . . . . . . . . . . . .
10
3.0
Oceania. . . . . . . . . . . . . . . . . . . . . . . . . . . . . . . . . . . . .
-
-
Latin America . . . . . . . . . . . . . . . . . . . . . . . . . . . . . . . .
63
19.1
Northern America. . . . . . . . . . . . . . . . . . . . . . . . . . . . .
43
13.1
LANGUAGE SPOKEN AT HOME
Population 5 years and over . . . . . . . . . . . . . .
27,076
100.0
English only . . . . . . . . . . . . . . . . . . . . . . . . . . . . . . . . .
26,499
97.9
Language other than English . . . . . . . . . . . . . . . . . .
577
2.1
Speak English less than very well. . . . . . . .
209
0.8
Spanish . . . . . . . . . . . . . . . . . . . . . . . . . . . . . . . . . . .
332
1.2
Speak English less than very well. . . . . . . .
97
0.4
Other Indo-European languages . . . . . . . . . . . . .
167
0.6
Speak English less than very well. . . . . . . .
57
0.2
Asian and Pacific Island languages. . . . . . . . . . .
68
0.3
Speak English less than very well. . . . . . . .
48
0.2
ANCESTRY (single or multiple)
Total population. . . . . . . . . . . . . . . . . . . . . . . . . .
28,658
100.0
Total ancestries reported . . . . . . . . . . . . . . . . . . .
25,820
90.1
Arab . . . . . . . . . . . . . . . . . . . . . . . . . . . . . . . . . . . . . . . .
18
0.1
Czech
1
. . . . . . . . . . . . . . . . . . . . . . . . . . . . . . . . . . . . . .
197
0.7
Danish . . . . . . . . . . . . . . . . . . . . . . . . . . . . . . . . . . . . . .
167
0.6
Dutch . . . . . . . . . . . . . . . . . . . . . . . . . . . . . . . . . . . . . . .
643
2.2
English. . . . . . . . . . . . . . . . . . . . . . . . . . . . . . . . . . . . . .
3,101
10.8
French (except Basque)
1
. . . . . . . . . . . . . . . . . . . . . .
1,096
3.8
French Canadian
1
. . . . . . . . . . . . . . . . . . . . . . . . . . . .
180
0.6
German . . . . . . . . . . . . . . . . . . . . . . . . . . . . . . . . . . . . .
5,344
18.6
Greek. . . . . . . . . . . . . . . . . . . . . . . . . . . . . . . . . . . . . . .
49
0.2
Hungarian . . . . . . . . . . . . . . . . . . . . . . . . . . . . . . . . . . .
75
0.3
Irish
1
. . . . . . . . . . . . . . . . . . . . . . . . . . . . . . . . . . . . . . . .
3,549
12.4
Italian . . . . . . . . . . . . . . . . . . . . . . . . . . . . . . . . . . . . . . .
739
2.6
Lithuanian . . . . . . . . . . . . . . . . . . . . . . . . . . . . . . . . . . .
52
0.2
Norwegian. . . . . . . . . . . . . . . . . . . . . . . . . . . . . . . . . . .
360
1.3
Polish. . . . . . . . . . . . . . . . . . . . . . . . . . . . . . . . . . . . . . .
424
1.5
Portuguese . . . . . . . . . . . . . . . . . . . . . . . . . . . . . . . . . .
20
0.1
Russian . . . . . . . . . . . . . . . . . . . . . . . . . . . . . . . . . . . . .
34
0.1
Scotch-Irish. . . . . . . . . . . . . . . . . . . . . . . . . . . . . . . . . .
584
2.0
Scottish . . . . . . . . . . . . . . . . . . . . . . . . . . . . . . . . . . . . .
514
1.8
Slovak . . . . . . . . . . . . . . . . . . . . . . . . . . . . . . . . . . . . . .
33
0.1
Subsaharan African. . . . . . . . . . . . . . . . . . . . . . . . . . .
12
-
Swedish. . . . . . . . . . . . . . . . . . . . . . . . . . . . . . . . . . . . .
393
1.4
Swiss . . . . . . . . . . . . . . . . . . . . . . . . . . . . . . . . . . . . . . .
110
0.4
Ukrainian. . . . . . . . . . . . . . . . . . . . . . . . . . . . . . . . . . . .
27
0.1
United States or American. . . . . . . . . . . . . . . . . . . . .
4,700
16.4
Welsh. . . . . . . . . . . . . . . . . . . . . . . . . . . . . . . . . . . . . . .
204
0.7
West Indian (excluding Hispanic groups) . . . . . . . .
6
-
Other ancestries . . . . . . . . . . . . . . . . . . . . . . . . . . . . .
3,189
11.1
-Represents zero or rounds to zero. (X) Not applicable.
1
The data represent a combination of two ancestries shown separately in Summary File 3. Czech includes Czechoslovakian. French includes Alsa-
tian. French Canadian includes Acadian/Cajun. Irish includes Celtic.
Source: U.S. Bureau of the Census, Census 2000.
U.S. Census Bureau
2

Page 3
Table DP-3. Profile of Selected Economic Characteristics: 2000
Geographic area: Stone County, Missouri
[Data based on a sample. For information on confidentiality protection, sampling error, nonsampling error, and definitions, see text]
Subject
Number Percent
EMPLOYMENT STATUS
Population 16 years and over . . . . . . . . . . . .
23,324
100.0
In labor force . . . . . . . . . . . . . . . . . . . . . . . . . . . . . . . .
13,083
56.1
Civilian labor force. . . . . . . . . . . . . . . . . . . . . . . . . .
13,069
56.0
Employed . . . . . . . . . . . . . . . . . . . . . . . . . . . . . . .
11,816
50.7
Unemployed . . . . . . . . . . . . . . . . . . . . . . . . . . . . .
1,253
5.4
Percent of civilian labor force . . . . . . . . . . . .
9.6
(X)
Armed Forces. . . . . . . . . . . . . . . . . . . . . . . . . . . . . .
14
0.1
Not in labor force. . . . . . . . . . . . . . . . . . . . . . . . . . . . .
10,241
43.9
Females 16 years and over . . . . . . . . . . . . . .
12,067
100.0
In labor force . . . . . . . . . . . . . . . . . . . . . . . . . . . . . . . .
6,099
50.5
Civilian labor force. . . . . . . . . . . . . . . . . . . . . . . . . .
6,099
50.5
Employed . . . . . . . . . . . . . . . . . . . . . . . . . . . . . . .
5,418
44.9
Own children under 6 years. . . . . . . . . . . . . .
1,759
100.0
All parents in family in labor force . . . . . . . . . . . . . .
1,192
67.8
COMMUTING TO WORK
Workers 16 years and over . . . . . . . . . . . . . .
11,640
100.0
Car, truck, or van - - drove alone. . . . . . . . . . . . . . .
8,794
75.5
Car, truck, or van - - carpooled. . . . . . . . . . . . . . . . .
1,807
15.5
Public transportation (including taxicab) . . . . . . . . .
9
0.1
Walked. . . . . . . . . . . . . . . . . . . . . . . . . . . . . . . . . . . . . .
283
2.4
Other means. . . . . . . . . . . . . . . . . . . . . . . . . . . . . . . . .
50
0.4
Worked at home . . . . . . . . . . . . . . . . . . . . . . . . . . . . .
697
6.0
Mean travel time to work (minutes)
1
. . . . . . . . . . . .
30.1
(X)
Employed civilian population
16 years and over . . . . . . . . . . . . . . . . . . . . .
11,816
100.0
OCCUPATION
Management, professional, and related
occupations . . . . . . . . . . . . . . . . . . . . . . . . . . . . . . . .
2,775
23.5
Service occupations . . . . . . . . . . . . . . . . . . . . . . . . . .
2,300
19.5
Sales and office occupations . . . . . . . . . . . . . . . . . .
3,273
27.7
Farming, fishing, and forestry occupations. . . . . . .
87
0.7
Construction, extraction, and maintenance
occupations . . . . . . . . . . . . . . . . . . . . . . . . . . . . . . . .
1,756
14.9
Production, transportation, and material moving
occupations . . . . . . . . . . . . . . . . . . . . . . . . . . . . . . . .
1,625
13.8
INDUSTRY
Agriculture, forestry, fishing and hunting,
and mining . . . . . . . . . . . . . . . . . . . . . . . . . . . . . . . . .
372
3.1
Construction . . . . . . . . . . . . . . . . . . . . . . . . . . . . . . . . .
1,476
12.5
Manufacturing. . . . . . . . . . . . . . . . . . . . . . . . . . . . . . . .
1,063
9.0
Wholesale trade. . . . . . . . . . . . . . . . . . . . . . . . . . . . . .
302
2.6
Retail trade . . . . . . . . . . . . . . . . . . . . . . . . . . . . . . . . . .
1,637
13.9
Transportation and warehousing, and utilities . . . .
521
4.4
Information . . . . . . . . . . . . . . . . . . . . . . . . . . . . . . . . . .
224
1.9
Finance, insurance, real estate, and rental and
leasing. . . . . . . . . . . . . . . . . . . . . . . . . . . . . . . . . . . . .
576
4.9
Professional, scientific, management, adminis-
trative, and waste management services . . . . . . .
662
5.6
Educational, health and social services . . . . . . . . .
1,662
14.1
Arts, entertainment, recreation, accommodation
and food services . . . . . . . . . . . . . . . . . . . . . . . . . . .
2,466
20.9
Other services (except public administration) . . . .
540
4.6
Public administration. . . . . . . . . . . . . . . . . . . . . . . . . .
315
2.7
CLASS OF WORKER
Private wage and salary workers . . . . . . . . . . . . . . .
8,989
76.1
Government workers. . . . . . . . . . . . . . . . . . . . . . . . . .
1,177
10.0
Self-employed workers in own not incorporated
business . . . . . . . . . . . . . . . . . . . . . . . . . . . . . . . . . . .
1,585
13.4
Unpaid family workers . . . . . . . . . . . . . . . . . . . . . . . .
65
0.6
Subject
Number Percent
INCOME IN 1999
Households. . . . . . . . . . . . . . . . . . . . . . . . . . . . .
11,824
100.0
Less than $10,000. . . . . . . . . . . . . . . . . . . . . . . . . . . .
1,252
10.6
$10,000 to $14,999. . . . . . . . . . . . . . . . . . . . . . . . . . .
970
8.2
$15,000 to $24,999. . . . . . . . . . . . . . . . . . . . . . . . . . .
1,984
16.8
$25,000 to $34,999. . . . . . . . . . . . . . . . . . . . . . . . . . .
2,207
18.7
$35,000 to $49,999. . . . . . . . . . . . . . . . . . . . . . . . . . .
2,273
19.2
$50,000 to $74,999. . . . . . . . . . . . . . . . . . . . . . . . . . .
1,841
15.6
$75,000 to $99,999. . . . . . . . . . . . . . . . . . . . . . . . . . .
683
5.8
$100,000 to $149,999. . . . . . . . . . . . . . . . . . . . . . . . .
366
3.1
$150,000 to $199,999. . . . . . . . . . . . . . . . . . . . . . . . .
110
0.9
$200,000 or more . . . . . . . . . . . . . . . . . . . . . . . . . . . .
138
1.2
Median household income (dollars). . . . . . . . . . . . .
32,637
(X)
With earnings . . . . . . . . . . . . . . . . . . . . . . . . . . . . . . . .
8,657
73.2
Mean earnings (dollars)
1
. . . . . . . . . . . . . . . . . . . .
39,133
(X)
With Social Security income . . . . . . . . . . . . . . . . . . .
4,547
38.5
Mean Social Security income (dollars)
1
. . . . . . .
11,408
(X)
With Supplemental Security Income . . . . . . . . . . . .
528
4.5
Mean Supplemental Security Income
(dollars)
1
. . . . . . . . . . . . . . . . . . . . . . . . . . . . . . . . .
5,872
(X)
With public assistance income . . . . . . . . . . . . . . . . .
369
3.1
Mean public assistance income (dollars)
1
. . . . .
2,084
(X)
With retirement income . . . . . . . . . . . . . . . . . . . . . . .
2,991
25.3
Mean retirement income (dollars)
1
. . . . . . . . . . . .
16,399
(X)
Families . . . . . . . . . . . . . . . . . . . . . . . . . . . . . . . .
8,858
100.0
Less than $10,000. . . . . . . . . . . . . . . . . . . . . . . . . . . .
462
5.2
$10,000 to $14,999. . . . . . . . . . . . . . . . . . . . . . . . . . .
595
6.7
$15,000 to $24,999. . . . . . . . . . . . . . . . . . . . . . . . . . .
1,322
14.9
$25,000 to $34,999. . . . . . . . . . . . . . . . . . . . . . . . . . .
1,704
19.2
$35,000 to $49,999. . . . . . . . . . . . . . . . . . . . . . . . . . .
1,959
22.1
$50,000 to $74,999. . . . . . . . . . . . . . . . . . . . . . . . . . .
1,675
18.9
$75,000 to $99,999. . . . . . . . . . . . . . . . . . . . . . . . . . .
618
7.0
$100,000 to $149,999. . . . . . . . . . . . . . . . . . . . . . . . .
319
3.6
$150,000 to $199,999. . . . . . . . . . . . . . . . . . . . . . . . .
97
1.1
$200,000 or more . . . . . . . . . . . . . . . . . . . . . . . . . . . .
107
1.2
Median family income (dollars). . . . . . . . . . . . . . . . .
36,844
(X)
Per capita income (dollars)
1
. . . . . . . . . . . . . . . . . . .
18,036
(X)
Median earnings (dollars):
Male full-time, year-round workers. . . . . . . . . . . . . .
26,224
(X)
Female full-time, year-round workers . . . . . . . . . . .
19,190
(X)
Subject
Number
below
poverty
level
Percent
below
poverty
level
POVERTY STATUS IN 1999
Families . . . . . . . . . . . . . . . . . . . . . . . . . . . . . . . .
755
8.5
With related children under 18 years. . . . . . . . . . . .
553
16.9
With related children under 5 years. . . . . . . . . . .
246
20.3
Families with female householder, no
husband present . . . . . . . . . . . . . . . . . . . . . . .
233
27.6
With related children under 18 years. . . . . . . . . . . .
215
39.2
With related children under 5 years. . . . . . . . . . .
60
39.2
Individuals. . . . . . . . . . . . . . . . . . . . . . . . . . . . . .
3,614
12.8
18 years and over . . . . . . . . . . . . . . . . . . . . . . . . . . . .
2,420
10.8
65 years and over . . . . . . . . . . . . . . . . . . . . . . . . . .
430
8.1
Related children under 18 years . . . . . . . . . . . . . . .
1,130
19.0
Related children 5 to 17 years . . . . . . . . . . . . . . .
833
19.0
Unrelated individuals 15 years and over. . . . . . . . .
1,160
29.7
-Represents zero or rounds to zero. (X) Not applicable.
1
If the denominator of a mean value or per capita value is less than 30, then that value is calculated using a rounded aggregate in the numerator.
See text.
Source: U.S. Bureau of the Census, Census 2000.
U.S. Census Bureau
3

Page 4
Table DP-4. Profile of Selected Housing Characteristics: 2000
Geographic area: Stone County, Missouri
[Data based on a sample. For information on confidentiality protection, sampling error, nonsampling error, and definitions, see text]
Subject
Number Percent
Total housing units. . . . . . . . . . . . . . . . . . . .
16,241
100.0
UNITS IN STRUCTURE
1-unit, detached. . . . . . . . . . . . . . . . . . . . . . . . . . . . . .
10,942
67.4
1-unit, attached . . . . . . . . . . . . . . . . . . . . . . . . . . . . . .
318
2.0
2 units . . . . . . . . . . . . . . . . . . . . . . . . . . . . . . . . . . . . . .
257
1.6
3 or 4 units . . . . . . . . . . . . . . . . . . . . . . . . . . . . . . . . . .
261
1.6
5 to 9 units . . . . . . . . . . . . . . . . . . . . . . . . . . . . . . . . . .
483
3.0
10 to 19 units . . . . . . . . . . . . . . . . . . . . . . . . . . . . . . . .
313
1.9
20 or more units . . . . . . . . . . . . . . . . . . . . . . . . . . . . .
18
0.1
Mobile home. . . . . . . . . . . . . . . . . . . . . . . . . . . . . . . . .
3,580
22.0
Boat, RV, van, etc . . . . . . . . . . . . . . . . . . . . . . . . . . . .
69
0.4
YEAR STRUCTURE BUILT
1999 to March 2000 . . . . . . . . . . . . . . . . . . . . . . . . . .
536
3.3
1995 to 1998 . . . . . . . . . . . . . . . . . . . . . . . . . . . . . . . .
2,229
13.7
1990 to 1994 . . . . . . . . . . . . . . . . . . . . . . . . . . . . . . . .
2,517
15.5
1980 to 1989 . . . . . . . . . . . . . . . . . . . . . . . . . . . . . . . .
3,075
18.9
1970 to 1979 . . . . . . . . . . . . . . . . . . . . . . . . . . . . . . . .
3,795
23.4
1960 to 1969 . . . . . . . . . . . . . . . . . . . . . . . . . . . . . . . .
1,872
11.5
1940 to 1959 . . . . . . . . . . . . . . . . . . . . . . . . . . . . . . . .
1,253
7.7
1939 or earlier . . . . . . . . . . . . . . . . . . . . . . . . . . . . . . .
964
5.9
ROOMS
1 room . . . . . . . . . . . . . . . . . . . . . . . . . . . . . . . . . . . . . .
143
0.9
2 rooms . . . . . . . . . . . . . . . . . . . . . . . . . . . . . . . . . . . . .
375
2.3
3 rooms . . . . . . . . . . . . . . . . . . . . . . . . . . . . . . . . . . . . .
1,106
6.8
4 rooms . . . . . . . . . . . . . . . . . . . . . . . . . . . . . . . . . . . . .
3,483
21.4
5 rooms . . . . . . . . . . . . . . . . . . . . . . . . . . . . . . . . . . . . .
3,887
23.9
6 rooms . . . . . . . . . . . . . . . . . . . . . . . . . . . . . . . . . . . . .
3,152
19.4
7 rooms . . . . . . . . . . . . . . . . . . . . . . . . . . . . . . . . . . . . .
1,891
11.6
8 rooms . . . . . . . . . . . . . . . . . . . . . . . . . . . . . . . . . . . . .
989
6.1
9 or more rooms . . . . . . . . . . . . . . . . . . . . . . . . . . . . .
1,215
7.5
Median (rooms) . . . . . . . . . . . . . . . . . . . . . . . . . . . . . .
5.3
(X)
Occupied housing units . . . . . . . . . . . . . . .
11,822
100.0
YEAR HOUSEHOLDER MOVED INTO UNIT
1999 to March 2000 . . . . . . . . . . . . . . . . . . . . . . . . . .
2,185
18.5
1995 to 1998 . . . . . . . . . . . . . . . . . . . . . . . . . . . . . . . .
3,838
32.5
1990 to 1994 . . . . . . . . . . . . . . . . . . . . . . . . . . . . . . . .
2,500
21.1
1980 to 1989 . . . . . . . . . . . . . . . . . . . . . . . . . . . . . . . .
1,894
16.0
1970 to 1979 . . . . . . . . . . . . . . . . . . . . . . . . . . . . . . . .
881
7.5
1969 or earlier . . . . . . . . . . . . . . . . . . . . . . . . . . . . . . .
524
4.4
VEHICLES AVAILABLE
None . . . . . . . . . . . . . . . . . . . . . . . . . . . . . . . . . . . . . . .
573
4.8
1 . . . . . . . . . . . . . . . . . . . . . . . . . . . . . . . . . . . . . . . . . . .
3,545
30.0
2 . . . . . . . . . . . . . . . . . . . . . . . . . . . . . . . . . . . . . . . . . . .
5,403
45.7
3 or more . . . . . . . . . . . . . . . . . . . . . . . . . . . . . . . . . . .
2,301
19.5
HOUSE HEATING FUEL
Utility gas . . . . . . . . . . . . . . . . . . . . . . . . . . . . . . . . . . .
615
5.2
Bottled, tank, or LP gas . . . . . . . . . . . . . . . . . . . . . . .
4,920
41.6
Electricity. . . . . . . . . . . . . . . . . . . . . . . . . . . . . . . . . . . .
5,213
44.1
Fuel oil, kerosene, etc . . . . . . . . . . . . . . . . . . . . . . . .
23
0.2
Coal or coke. . . . . . . . . . . . . . . . . . . . . . . . . . . . . . . . .
-
-
Wood . . . . . . . . . . . . . . . . . . . . . . . . . . . . . . . . . . . . . . .
983
8.3
Solar energy. . . . . . . . . . . . . . . . . . . . . . . . . . . . . . . . .
5
-
Other fuel . . . . . . . . . . . . . . . . . . . . . . . . . . . . . . . . . . .
45
0.4
No fuel used. . . . . . . . . . . . . . . . . . . . . . . . . . . . . . . . .
18
0.2
SELECTED CHARACTERISTICS
Lacking complete plumbing facilities . . . . . . . . . . . .
45
0.4
Lacking complete kitchen facilities. . . . . . . . . . . . . .
46
0.4
No telephone service . . . . . . . . . . . . . . . . . . . . . . . . .
443
3.7
Subject
Number Percent
OCCUPANTS PER ROOM
Occupied housing units . . . . . . . . . . . . . . .
11,822
100.0
1.00 or less. . . . . . . . . . . . . . . . . . . . . . . . . . . . . . . . . .
11,499
97.3
1.01 to 1.50 . . . . . . . . . . . . . . . . . . . . . . . . . . . . . . . . .
227
1.9
1.51 or more. . . . . . . . . . . . . . . . . . . . . . . . . . . . . . . . .
96
0.8
Specified owner-occupied units . . . . . . . .
5,840
100.0
VALUE
Less than $50,000. . . . . . . . . . . . . . . . . . . . . . . . . . . .
689
11.8
$50,000 to $99,999. . . . . . . . . . . . . . . . . . . . . . . . . . .
2,144
36.7
$100,000 to $149,999. . . . . . . . . . . . . . . . . . . . . . . . .
1,571
26.9
$150,000 to $199,999. . . . . . . . . . . . . . . . . . . . . . . . .
690
11.8
$200,000 to $299,999. . . . . . . . . . . . . . . . . . . . . . . . .
576
9.9
$300,000 to $499,999. . . . . . . . . . . . . . . . . . . . . . . . .
126
2.2
$500,000 to $999,999. . . . . . . . . . . . . . . . . . . . . . . . .
44
0.8
$1,000,000 or more. . . . . . . . . . . . . . . . . . . . . . . . . . .
-
-
Median (dollars). . . . . . . . . . . . . . . . . . . . . . . . . . . . . .
102,700
(X)
MORTGAGE STATUS AND SELECTED
MONTHLY OWNER COSTS
With a mortgage . . . . . . . . . . . . . . . . . . . . . . . . . . . . .
3,331
57.0
Less than $300 . . . . . . . . . . . . . . . . . . . . . . . . . .
43
0.7
$300 to $499 . . . . . . . . . . . . . . . . . . . . . . . . . . . .
473
8.1
$500 to $699 . . . . . . . . . . . . . . . . . . . . . . . . . . . .
810
13.9
$700 to $999 . . . . . . . . . . . . . . . . . . . . . . . . . . . .
1,094
18.7
$1,000 to $1,499 . . . . . . . . . . . . . . . . . . . . . . . . .
571
9.8
$1,500 to $1,999 . . . . . . . . . . . . . . . . . . . . . . . . .
221
3.8
$2,000 or more . . . . . . . . . . . . . . . . . . . . . . . . . .
119
2.0
Median (dollars). . . . . . . . . . . . . . . . . . . . . . . . . .
784
(X)
Not mortgaged . . . . . . . . . . . . . . . . . . . . . . . . . . . . . . .
2,509
43.0
Median (dollars). . . . . . . . . . . . . . . . . . . . . . . . . .
220
(X)
SELECTED MONTHLY OWNER COSTS
AS A PERCENTAGE OF HOUSEHOLD
INCOME IN 1999
Less than 15.0 percent. . . . . . . . . . . . . . . . . . . . . . . .
2,794
47.8
15.0 to 19.9 percent . . . . . . . . . . . . . . . . . . . . . . . . . .
719
12.3
20.0 to 24.9 percent . . . . . . . . . . . . . . . . . . . . . . . . . .
666
11.4
25.0 to 29.9 percent . . . . . . . . . . . . . . . . . . . . . . . . . .
414
7.1
30.0 to 34.9 percent . . . . . . . . . . . . . . . . . . . . . . . . . .
312
5.3
35.0 percent or more . . . . . . . . . . . . . . . . . . . . . . . . .
864
14.8
Not computed. . . . . . . . . . . . . . . . . . . . . . . . . . . . . . . .
71
1.2
Specified renter-occupied units . . . . . . . .
2,058
100.0
GROSS RENT
Less than $200 . . . . . . . . . . . . . . . . . . . . . . . . . . . . . .
92
4.5
$200 to $299 . . . . . . . . . . . . . . . . . . . . . . . . . . . . . . . .
219
10.6
$300 to $499 . . . . . . . . . . . . . . . . . . . . . . . . . . . . . . . .
735
35.7
$500 to $749 . . . . . . . . . . . . . . . . . . . . . . . . . . . . . . . .
610
29.6
$750 to $999 . . . . . . . . . . . . . . . . . . . . . . . . . . . . . . . .
96
4.7
$1,000 to $1,499 . . . . . . . . . . . . . . . . . . . . . . . . . . . . .
24
1.2
$1,500 or more . . . . . . . . . . . . . . . . . . . . . . . . . . . . . .
-
-
No cash rent. . . . . . . . . . . . . . . . . . . . . . . . . . . . . . . . .
282
13.7
Median (dollars). . . . . . . . . . . . . . . . . . . . . . . . . . . . . .
468
(X)
GROSS RENT AS A PERCENTAGE OF
HOUSEHOLD INCOME IN 1999
Less than 15.0 percent. . . . . . . . . . . . . . . . . . . . . . . .
304
14.8
15.0 to 19.9 percent . . . . . . . . . . . . . . . . . . . . . . . . . .
277
13.5
20.0 to 24.9 percent . . . . . . . . . . . . . . . . . . . . . . . . . .
249
12.1<